
Golang Profile and Optimize
I. Profile
在进行 API 压测、全链路压测、线上生产环境被高峰流量打爆的过程中随时可能发生故障等问题,例如:
- CPU 占用过高,超过 90%;
- 内存爆掉,OOM(Out of memory);
- Goroutine 数量过多,80W;
- 线程数超高;
- 延迟过高;
在发生以上故障时,一般需要结合 pprof 寻找故障原因,并根据不同的情况选择不同的方案;
线上一定要具有开启
pprof的能力,如果考虑安全性,也要具有通过配置开启的能力;
压测时需要关注的服务指标
- Request rate: The number of service requests per second.
- Errors: The number of request that failed.
- Duration: The time for requests to complete.
- Goroutine / Thread 数量: 如果 Goroutine 数量很多,需要关注这些 Goroutine 的执行情况.
- GC 频率
- gctrace 的内容:
- GC 的 STW 时间
还有一些其他 Memstats 相关的其他指标,可以参考 Prometheus.
压测手段
- wrk: a HTTP benchmarking tool
- wrk2: a HTTP benchmarking tool based mostly on wrk
- HEY: a tiny program that sends some load to a web application.
- Vegate: a versatile HTTP load testing tool built out of a need to drill HTTP services with a constant request rate.
- h2load: HTTP/2 benchmarking tool
- ghz: gRPC benchmarking and load testing tool
pprof 应用实例
|
|
|
|
注意事项
- 测试代码中引入
net/http/pprof包:_ "net/http/pprof"- 单独启动一个 Goroutine 开启监听(端口自定,例如这里是 8080):
go func() { http.ListenAndServe(":8080", nil) }()$ go tool pprof -http=:9999 localhost:8080/debug/pprof/heap
II. Optimize
优化方向

在分析上图的应用程序运行过程,可以发现进行程序优化时,一般从可以从以下方面入手:
- 应用层优化: 主要指的是逻辑优化、内存使用优化、CPU 使用优化、阻塞优化等,并且本层优化效果可能优于底层优化;
- 底层优化:GC优化、Go 标准库优化、Go runtime 优化等
基本优化流程
- 外部依赖:在监控系统中查看是否存在问题,例如依赖的上游服务 (DB/redis/MQ) 延迟过高;
- CPU 占用:通过查看 CPU profile 检查是否存在问题,优化占用 CPU 较多的部分逻辑;
- 内存占用:看 Prometheus,内存 RSS / Goroutine 数量 / Goroutine 栈占用 –» 如果 Goroutine 数量不多,则重点关注 heap profile 中的 inuse –» 定时任务类需要看 alloc
- Goroutine 数量过多 –» 从 profile 网页进去看看 Goroutine 的执行情况(在干什么?) –» 检查死锁、阻塞等问题 –» 个别不在意延迟的选择第三方库优化
常见优化场景
字符串拼接
|
|
|
|
逃逸分析
用户声明的对象,被放在栈上还是堆上?
可以通过编译器的 escape analysis 来决定 go build -gcflags="-m" xxx.go
|
|
|
|
TODO: 各种逃逸分析的可能性有哪些?
Trasval 2-D Matrix
|
|
|
|
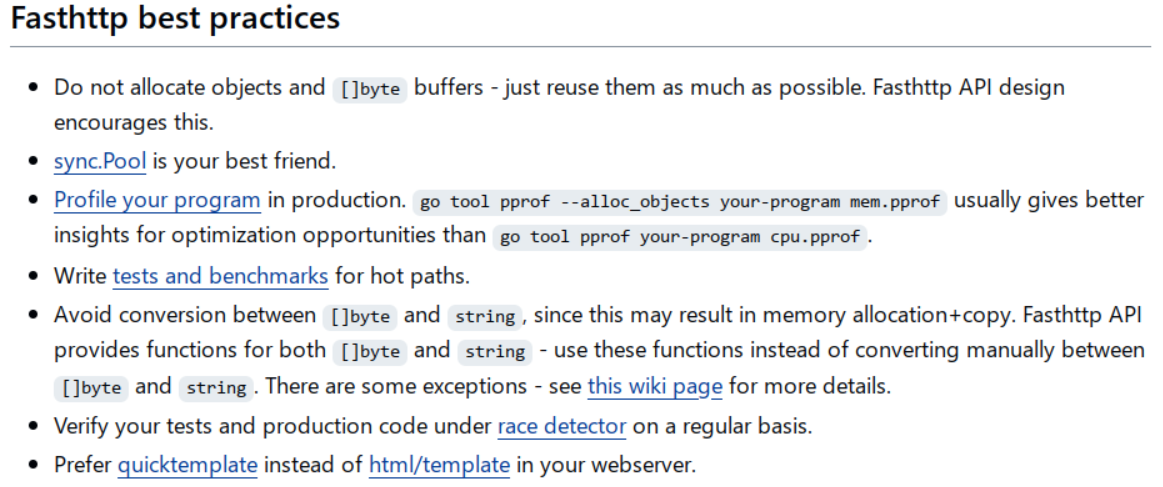
Zero Garbage / Allocation
Zero Grabage 一般指的是通过利用 sync.Pool 将堆分配完全消灭的优化技术。
例如,在 http router 框架 fasthttp 中应用较多.
False Sharing

CPU 运行过程中修改数据是一个 cache line为单位,当两个变量A/B满足以下条件:
- 在内存中相邻
- 并发修改频繁
那么,当 CPU0 修改变量 A 时,会导致 CPU1 中的变量 B 缓存失效。
解决方法,在定义数据结构中,填充一些 padding 用以满足该数据结构正好是 cache line 的整数倍;
|
|
查看 cache line 大小:
cat /sys/devices/system/cpu/cpu<core-num>/cache/index0/coherency_line_size
降低外部命令调用频次
优化前:
|
|
优化后:
|
|
总结:
- 线上使用
exec命令是非常危险的- 采用第三方库代替外部命令
阻塞导致高延迟
锁阻塞
|
|
- 减小临界区 - 优化后:
|
|
在后端系统开发中,锁瓶颈是较常见的问题,例如文件锁
-
双 Buffer 完全干掉锁阻塞
使用双 Buffer / RCU 完全消除读阻塞:全量更新,直接替换原 config
1 2 3 4 5 6 7 8 9 10 11 12func updateConfig() { var newConfig = &MyConfig { WhiteList: make(map[int]struct{}), } // Do a lot of compulation for i :=0; i < 1000; i++ { newConfig.WhiteList[i] = struct{}{} } config.Store(newConfig) }使用双 Buffer / RCU 完全消除读阻塞:部分更新,先拷贝原 config,然后更新 key,最后替换
1 2 3 4 5 6 7 8 9 10 11 12 13 14 15 16 17 18// Partial update func updateConfig() { var oldConfig = getConfig() var newConfig = &MyConfig{ WhiteList: make(map[int]struct{}) } // Copy from old for k,v := range oldConfig.WhiteList { newConfig.WhiteList[k] = v } // Modify some keys newConfig.WhiteList[123] = struct{}{} newConfig.WhiteList[124] = struct{}{} config.Store(newConfig) }NOTE: 当更新可能并发时,则需要在更新时加锁
优化锁阻塞瓶颈的手段总结:
- 减小临界区:只锁必须锁的对象,临界区内尽量不放慢操作,如
syscall- 降低锁粒度:全局锁 -> 对象锁,全局锁 -> 连接锁, 连接锁 -> 请求锁,文件锁 -> 多个文件各种锁
- 同步改异步:同步日志 -> 异步日志,若队列满则丢弃,不阻塞业务逻辑
CPU 使用太高
编解码使用 CPU 过高
通过更换 json 库,就可以提高系统的吞吐量:本质上是请求的 CPU 使用被优化了(可使用固定 QPS 压测来验证)
encoding/json–»json "github.com/json-iterator/go"
GC 使用 CPU 过高
- 将变化较少的结构放在堆外,通过 cgo 来管理内存,让 GC 发现不了这些对象,也就不会扫描了
- offheap,可以减少 Go 进程的内存占用和内存使用波动,但要用到 cgo
Manual Memory Management in Go using jemalloc
|
|
|
|
结论: 当 map 中含有大量的指针 key 时,会给 GC 扫描造成压力
解决方案(只适用于内存不紧张,且希望提高整体吞吐量的服务):
- 调大 GOGC
- 程序启动阶段 make 一个全局超大的 slice(如1GB)TODO 如何解决的?
内存占用过高
堆分配导致内存占用过高
|
|
|
|
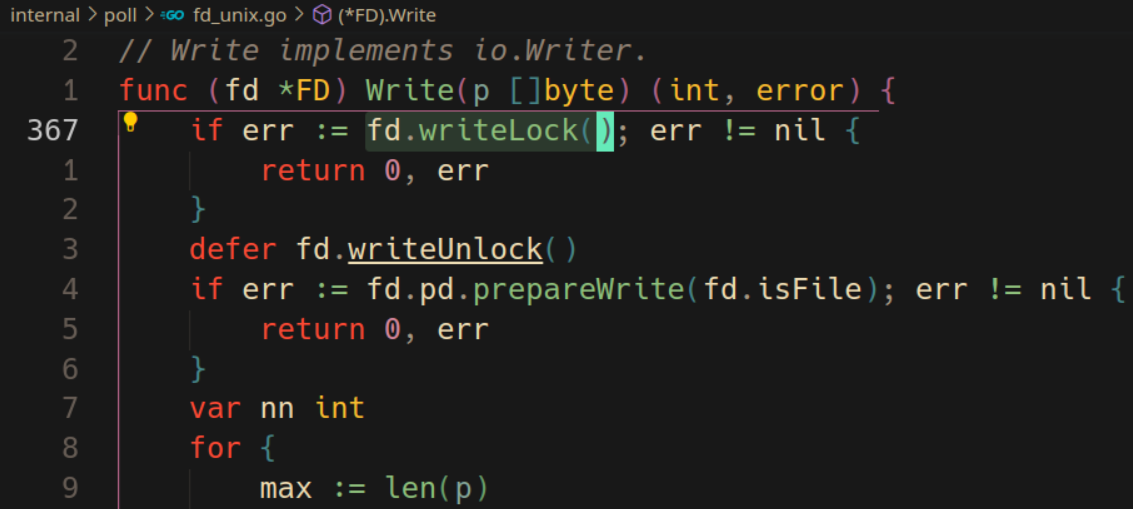
Goroutine 数量太多导致内存占用过高
Goroutine 涉及到的占用内存可能如下:
-
Goroutine 栈占用的内存(难优化,一条 TCP 连接至少对应一个 Goroutine)
-
TCP Read Buffer 占用的内存(难优化,因为大部分连接阻塞在 Read 上,Read Buffer 基本没有可以释放的时机)
1 2 3 4 5 6 7 8 9 10 11 12func f() { var l net.Listener for { c, _ := l.Accept() go func() { var buf = make([]byte, 4096) for { c.Read(buf) } }() } } -
TCP Writer Buffer 占用的内存(易优化,因为活跃连接不多)
原因:
gopark(...)的 Goroutine, 占用内存- 阻塞的 Read Buffer 很难找到时机释放,占用内存
Solution: 在一些不太重视延迟的场景中(例如推送系统),可以使用某些库进行优化:evio、gev、gnet、easygo、gaio、netpoll
NOTE: 一定要进行在真实业务场景中做压测,不要相信某些库的 README 中的压测数据
常见优化场景总结
- CPU 使用太高
- 应用逻辑导致
- JSON 序列化
- 使用一些优化的 JSON 库替代标准库
- 使用二进制编码方式代替 JSON 编码
- 同物理节点通信,使用共享内存 IPC,直接干掉序列化开销
- MD5 计算 HASH 值成本太高 –> 使用 cityhash, murmurhash
- 其他应用逻辑:只能具体情况具体分析
- JSON 序列化
- GC 使用 CPU 过高
- 减少堆上对象分配
sync.Pool进行堆对象重用Map->slice- 指针 -> 非指针对象
- 多个小对象 -> 合并为一个大对象
- offheap
- 降低 GC 频率
- 修改 GOGC
- 在程序开始时
make一个全局大slice
- 减少堆上对象分配
- 调度相关的函数使用 CPU 过高
- 尝试使用 Goroutine Pool,减少 Goroutine 的创建与销毁
- 控制最大 Goroutine 数量
- 应用逻辑导致
- 内存使用过高
- 堆内存占用内存空间过高
sync.Pool对象复用- 为不同大小的对象提供不同大小 level 的
sync.Pool - offheap
- Goroutine 栈占用过多内存
- 减少 Goroutine 数量
- 如每个连接一读一写 –» 合并为一个连接一个 goroutine
- Goroutine pool 限制最大 goroutine 数量
- 使用裸 epoll 库(evio, gev等)修改网络编程方式(只适用于对延迟不敏感的业务)
- 通过修改代码,减少函数调用层级(难)
- 减少 Goroutine 数量
- 堆内存占用内存空间过高
- 阻塞问题
- 上游系统阻塞
- 让上游赶紧解决
- 锁阻塞
- 减少临界区范围
- 降低锁粒度
- Global Lock –» Shareded Lock
- Global Lock –» Connection Level Lock
- Connection Level Lock –» Request Level Lock
- 同步改异步
- 日志场景:同步日志 –» 异步日志
- Metrics 上报场景:
select–»select+default
- 个别场景使用双 Buffer 完全消灭阻塞
- 上游系统阻塞
III. Coutinuous Profiling
压测是一个蹲点行为,然而真实场景并不美好,它们通常是难以发现的偶发问题:
- 该到吃饭的时候,CPU 使用尖刺
- 凌晨四点半,系统发生 OOM
- 刚睡着的时候,Goroutine 数量爆炸
- 产品被部署到客户那里,想登陆客户的环境并不方便
此时 Coutinuout Profiling 就派上用场了.

自省式的 Profile Dumper,可以根据 CPU 利用率、Memory 利用率、Goroutine 数量等多个指标检测系统,设置定时周期进行检测,当发现某个指标异常时,自动 Dump file.
IV. Summary
-
_pad优化,针对多个线程更新同一个结构体内不同的字段场景有效,而针对一个线程同时更新整个结构体的场景意义不大; -
第三方接口出现问题,如何保护自己的服务?
对外部调用必须有超时 ==> 熔断
-
goroutine 初始化栈空间为 2KB,最大 1GB,那么 heap 为什么不爆栈?
在 Go 语言中,goroutine 和 heap 使用单独的内存空间:Goroutine 有自己的堆栈空间,用于存储局部变量、函数帧和其他运行时信息;heap 则是一个共享内存空间,用于存储动态分配的对象,例如 slice、map 和 strings。
当 Goroutine 需要分配的内存多于起堆栈上的可用内存时,它将自动从 stack 中分配内存,采用的是 stack 分配机制完成,运行 goroutine 分配任何数量的内存,而不用担心 stack 空间耗尽; 除了堆分配之外,goroutine 还可以使用一种称为堆栈复制的技术来在它们之间共享数据,堆栈复制比堆分配更有效,但它只能用于共享足够小以适合堆栈的数据。
V. Reference
- Benchmarks Game
- Go Web Frame Benchmarks
- Go HTTP Router Benchmark
- Web 场景跨语言性能对比
- 《Systems Performance》
- Dave 分享的 High Performance Go Workshop
- go-perfbook: best practices for writing high-performance Go code
- Delve
- What is Continuous Profiling?
- Google-Wide Profiling: A Continuous Profiling Infrastructure for Data Centers